Real-Time Carbon Footprint Analytics Platform for Positive Carbon
WeSoftYou built a robust analytics platform for Positive Carbon, helping companies measure and reduce CO₂ emissions through automated data collection, visualization, and actionable insights.
Industry
Environmental Services, Sustainability & GreenTech, Data Analytics
Project duration
Ongoing (2023 – Present)
Country state
Ireland (Global Client Base)
Team
5
Technology
🏃
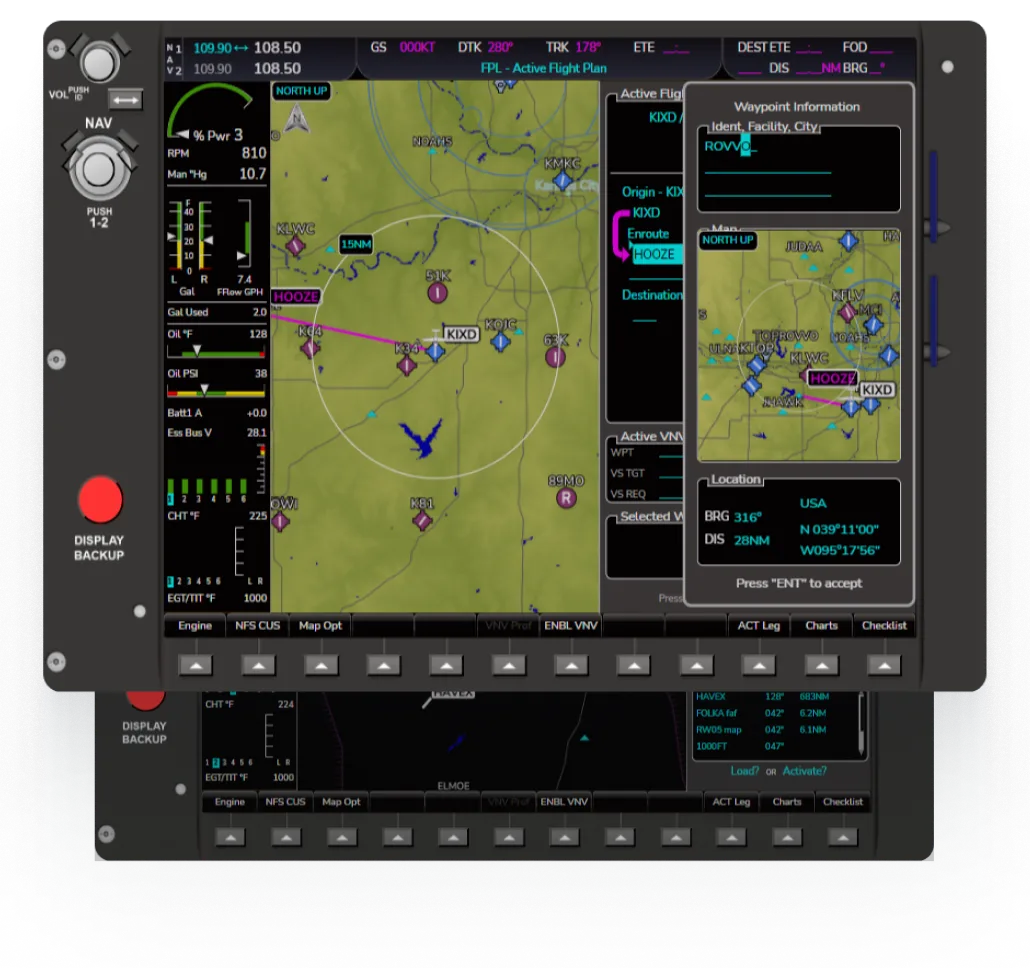
Positive Carbon is an environmental startup that delivers precise, real-time CO₂ monitoring to help companies track and reduce their carbon footprint. Faced with growing demand, they needed a platform that could ingest ERP, IoT and third-party API data, perform accurate emissions calculations and display results without delay.
Their objectives were clear: provide live, accurate carbon-emissions metrics; integrate seamlessly with each client’s existing data stack (IoT devices, ERP and CRM); and produce actionable dashboards along with automated reports for all stakeholders.
WeSoftYou answered the call with a modern, scalable architecture that normalizes incoming data, applies advanced CO₂ conversion algorithms and aggregates results. Insights appear in interactive dashboards, while scheduled reporting workflows deliver tailored summaries to operations, sustainability and compliance teams—ensuring businesses stay on track with their environmental goals and regulatory requirements.
Results ✨
€250K+ Savings per Client
Annual savings driven by reducing food waste and improving operational efficiency.
70+ Staff Hours Saved Monthly
Per site, through automation and real-time insights.
1,200+ Active Users
Kitchen staff use the platform to track, analyze, and reduce waste.
50+ New Enterprise Clients
Including major hospitality groups, universities, and large-scale caterers.
Project goals ⚡️
Implement a real-time analytics pipeline to capture and calculate emissions data.
Integrate seamlessly with existing enterprise systems (ERP, IoT sensors, etc.).
Enable clear, easy-to-share dashboards and reports for diverse user roles.
Ensure the solution adheres to international environmental standards and regulations.
Challenges ⛰
01.
Complex Integrations: Each client had unique data sources (IoT devices, ERP, manual logs).
02.
Data Validation: Ensuring high accuracy across multiple data streams and formats.
03.
Global Regulations: Different regions required different compliance and reporting formats.
04.
Performance at Scale: Processing large volumes of data in near real-time without downtime.
The process 🚧
To deliver a scalable and reliable solution for Positive Carbon, we followed a structured development process supported by a modern tech stack. Each stage — from initial discovery to deployment and support — was designed to ensure seamless data handling, regulatory compliance, and high system performance.
Stages 🎢
01.
Discovery & Requirements Gathering: Analyzed Positive Carbon’s existing workflows and pain points. Identified key integrations (AWS IoT, third-party climate APIs, etc.). Defined scope based on regulatory needs (ISO 14064, GHG Protocol).
02.
Architectural Planning: Chose Node.js and Python for data processing and pipeline orchestration. Structured a multi-database approach (PostgreSQL for core data, TimescaleDB for time-series data). Established microservices and containerized deployments using Docker and Kubernetes.
03.
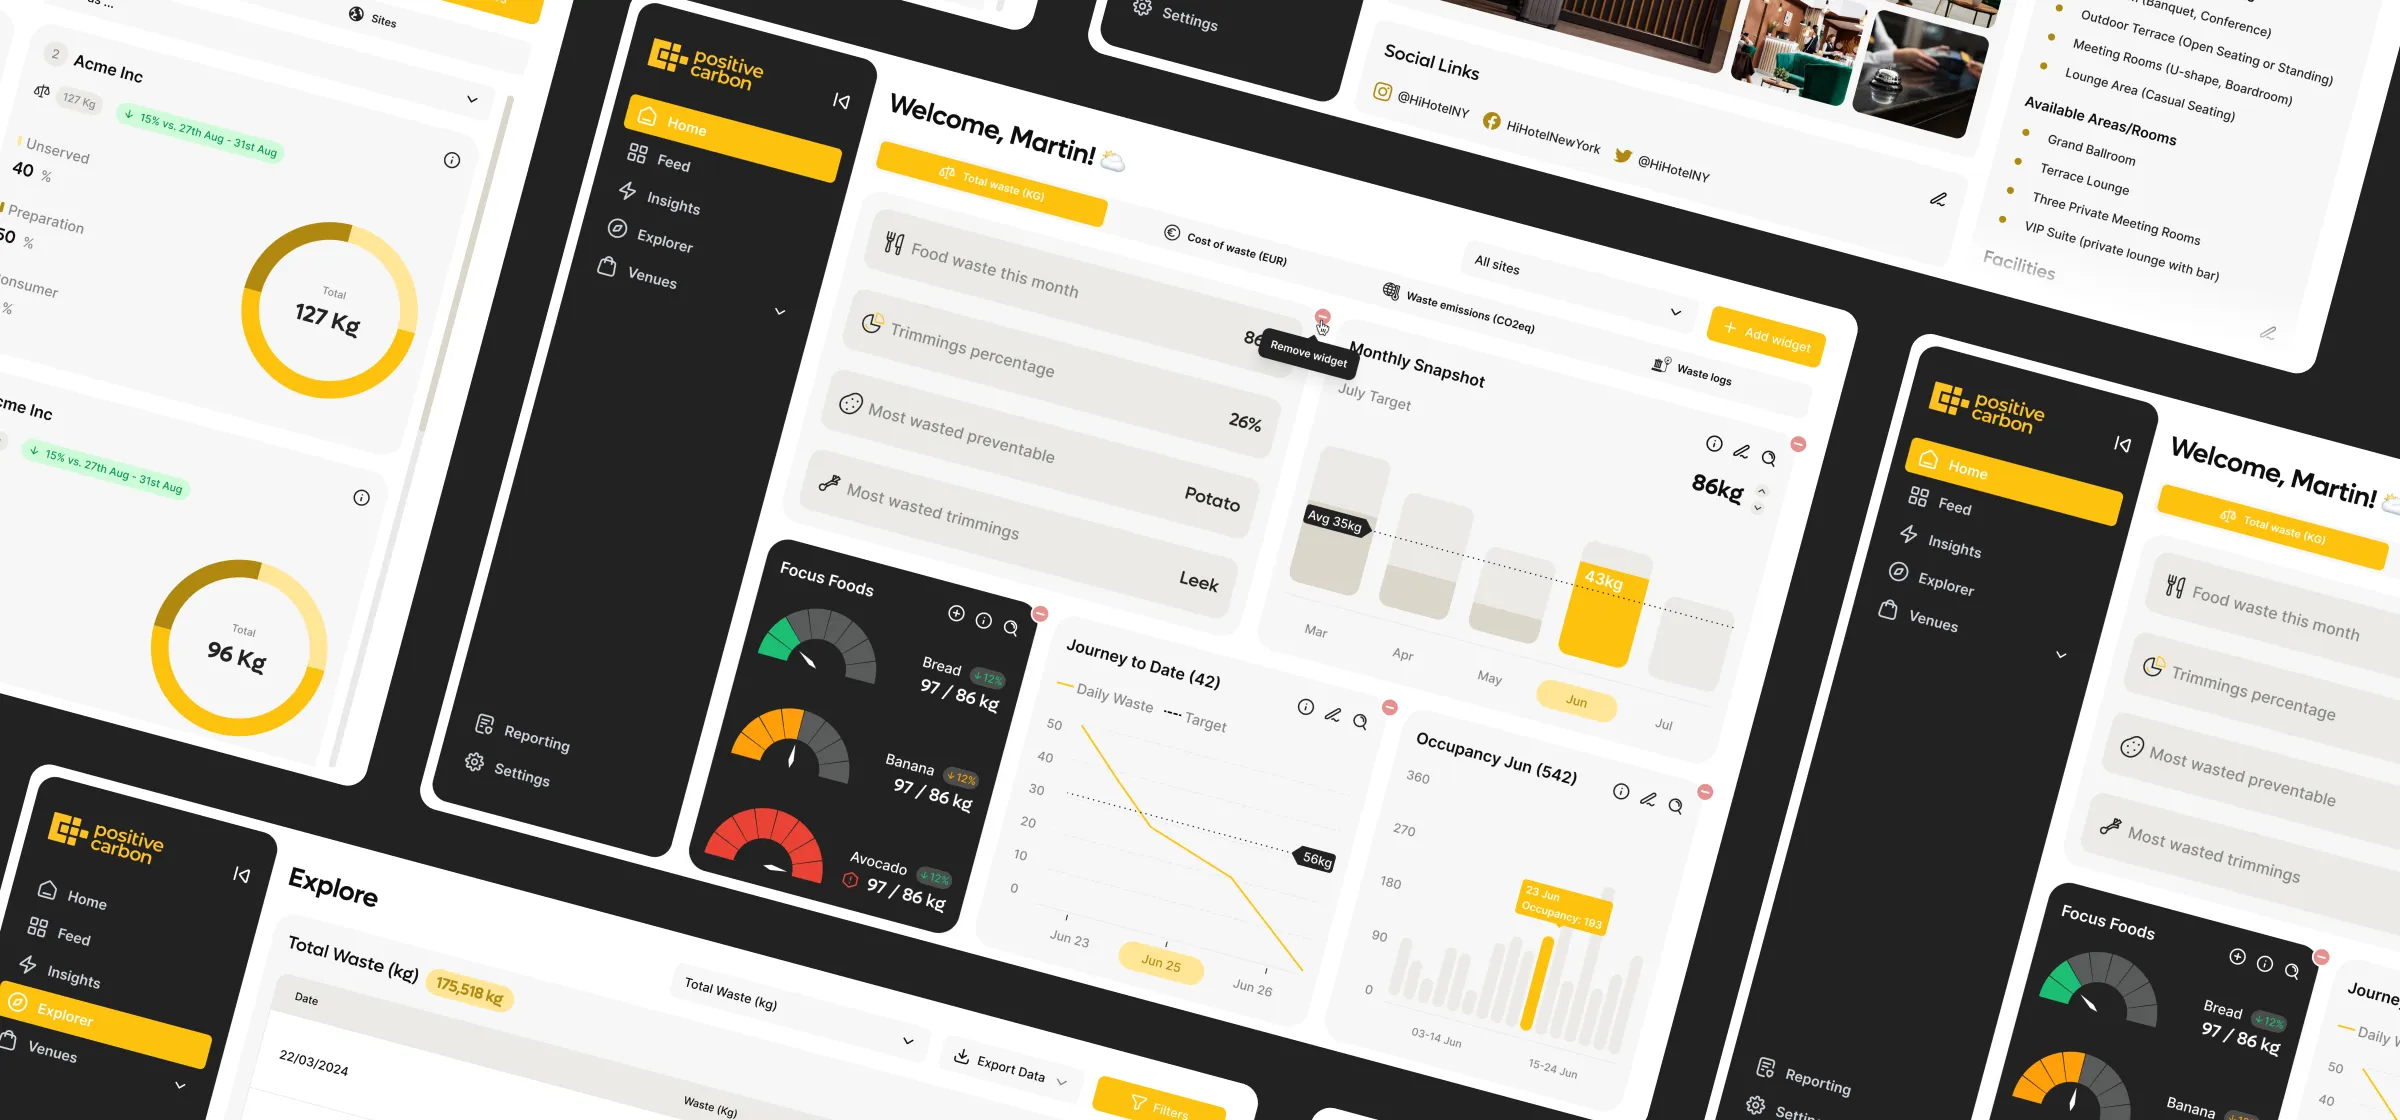
Core Platform Development: Built an ingestion service to standardize data from IoT devices and APIs. Implemented real-time dashboards using React.js and D3.js for interactive visualization. Added advanced filtering and analytics tools to dissect carbon emissions by location, process, or time.
04.
Testing & Validation: Employed automated unit tests, integration tests, and QA cycles to validate data accuracy. Stress-tested the system’s ability to handle spikes in data volume from connected sensors.
05.
Deployment & Ongoing Support: Deployed on AWS for global accessibility and automatic scaling. Provided continuous monitoring, real-time alerts, and periodic performance tuning. Supported additional feature requests, including new compliance reports and custom analytics modules.
Team composition 👨💻
- 1 Project Manager
- 1 Back-End Developer
- 1 Front-End Developer
- 1 Quality Assurance Engineer
- 1 Back-End Tech Lead
Technology stack ⚙️
Back-end: Python, Django
Front-end: React, Redux, Material design, Rsuite
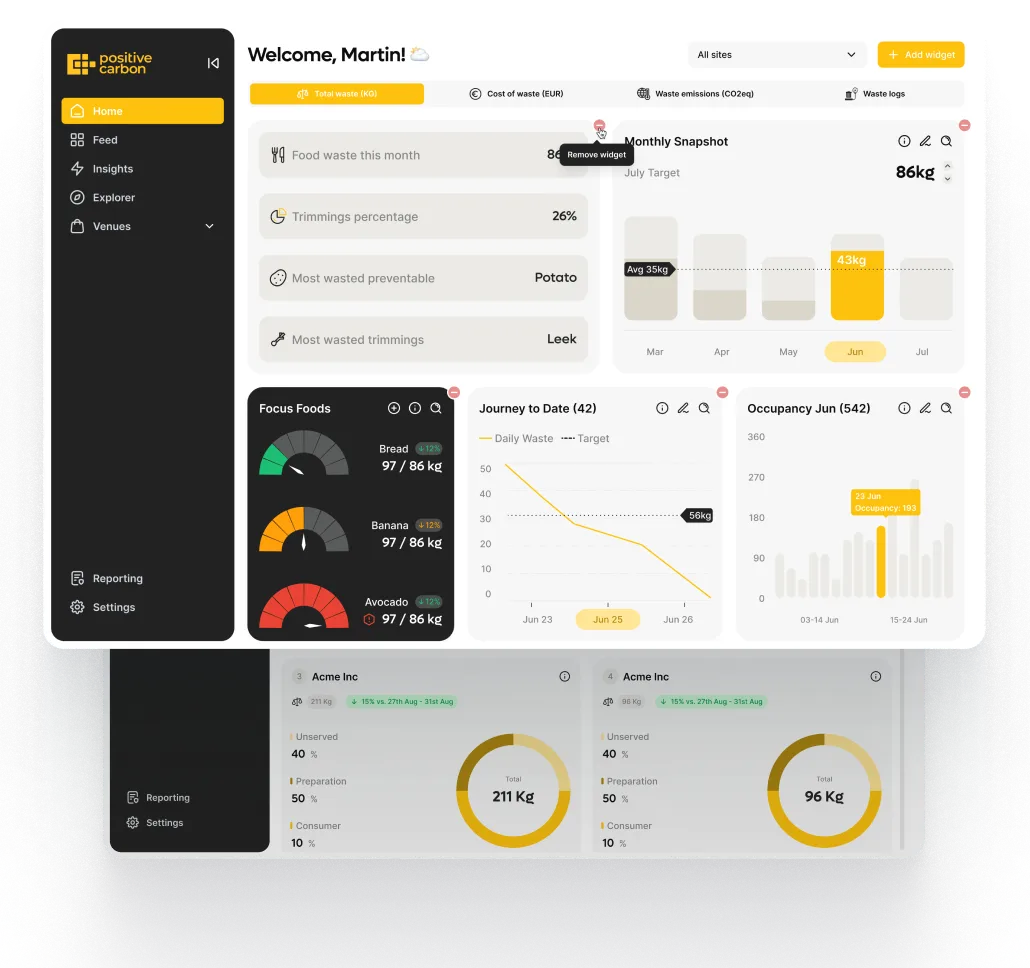
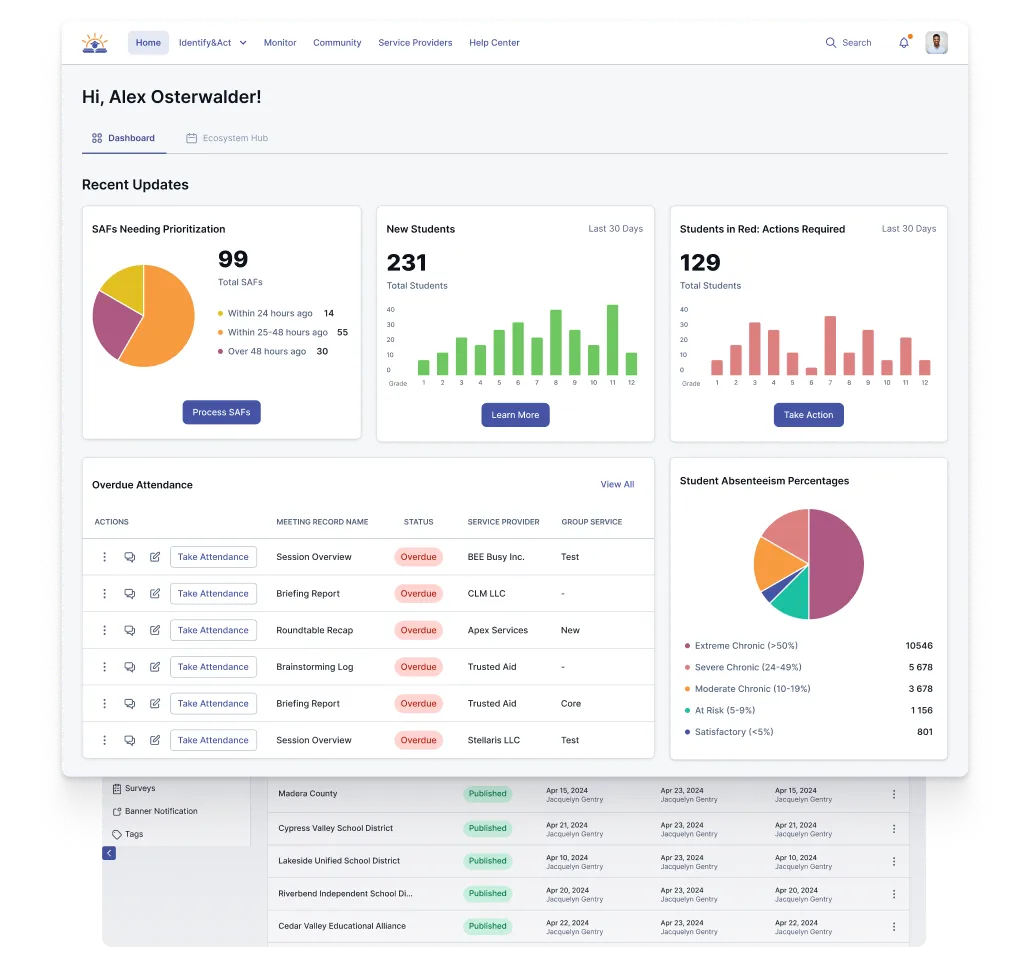
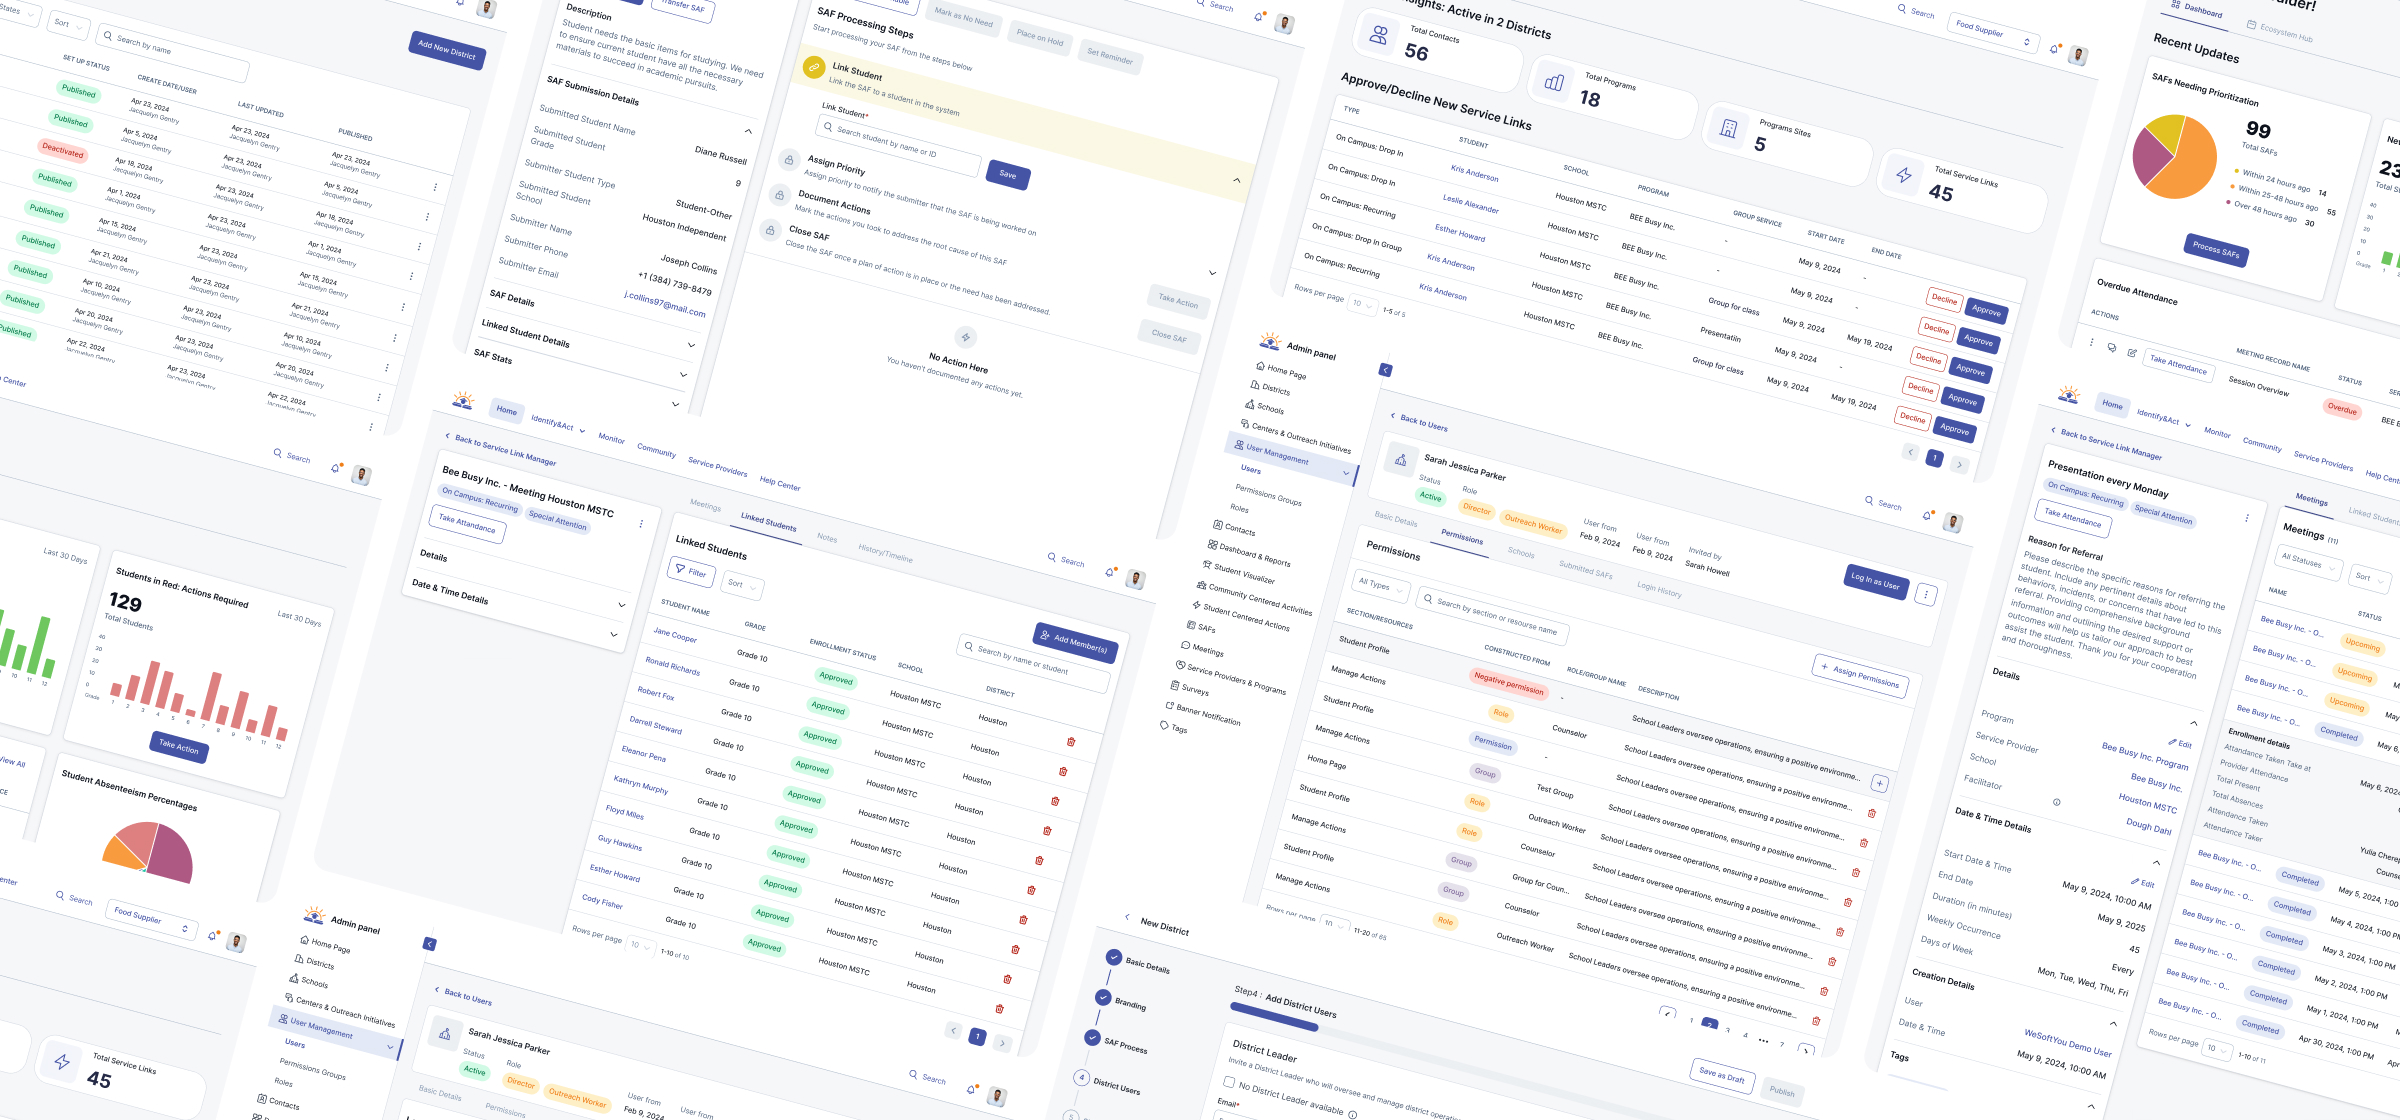
Core features 💻

Carbon Emissions Dashboard
- Interactive charts and real-time metrics to monitor CO₂ output.
- Drill-down functionality to identify high-emission sources.

Automated Reporting
- Scheduled generation of compliance reports (GHG Protocol, custom standards).
- One-click export features for stakeholders and auditors.

Multi-Source Data Integration
- Connects to IoT sensors, production systems, and ERP solutions via REST and streaming APIs.
- Normalizes data for unified tracking and analytics.

Alerts & Notifications
- Threshold-based alerts for sudden spikes in emissions.
- Automated email/SMS notifications for compliance deadlines.

Role-Based Access Control
- Secured logins for admins, partners, and auditors with tiered permissions.
- Ensures sensitive data is accessed only by authorized personnel.
Do you want to start a project?

Meet us across the globe

United States
66 W Flagler st Unit 919 Miami, FL, 33130
Europe
109 Borough High St, London SE1 1NL, UKProsta 20/00-850, 00-850 Warszawa, Poland
Vasyl Tyutyunnik St, 5A, Kyiv, Ukraine
Av. da Liberdade 10, 1250-147 Lisboa, Portugal